Updated:2024-11-29
Sampling rate, as one of the key indicators of oscilloscope performance, directly affects the accuracy and completeness of waveforms. This article will explore the impact of oscilloscope sampling rates on different waveforms and provide practical selection suggestions.
The Importance of Oscilloscope Sampling Rate
The working principle of an oscilloscope is shown in the figure below:

We input a signal to the oscilloscope through a probe. The signal under test passes through the oscilloscope's front-end amplification, attenuation, and other signal conditioning circuits, and then the high-speed ADC analog-to-digital converter samples and digitizes the signal. The sampling rate of the oscilloscope is the frequency of the sampling clock when performing analog-to-digital conversion on the input signal. In layman's terms, it is the sampling interval, with one sample point collected at each sampling interval. For example, a sampling rate of 1GSa/s indicates that the oscilloscope has the capability to collect 10 billion sample points per second, and its sampling interval is 1 nanosecond.
For real-time oscilloscopes, real-time sampling is commonly used. So-called real-time sampling is the continuous high-speed sampling of the waveform signal at equal intervals, and then the waveform is reconstructed or restored based on these continuous samples. In the process of real-time sampling, it is crucial to ensure that the oscilloscope's sampling rate is much faster than the changes in the signal under test.
So, how much faster should it be? According to Nyquist's law in digital signal processing, if the bandwidth of the signal under test is limited, then as long as the sampling rate is more than twice the bandwidth of the signal, it is possible to fully reconstruct or recover the information carried in the signal without aliasing.
The following figure shows signal aliasing caused by insufficient sampling rate. It can be seen that the collected signal has a much lower frequency compared to the original signal.

Testing the Impact of Different Sampling Rates on Different Waveforms
This article combines theory with practice and tests different sampling rates on 1.5MHz sine wave, 1.5MHz square wave, 150kHz sawtooth wave, and 150kHz triangle wave using an oscilloscope to observe the results.
We used Micsig's high-resolution oscilloscope MHO3-5004 for testing; the MHO3-5004 has a 500MHz bandwidth, 12-bit vertical resolution, 3GSa/s real-time sampling rate, 4 analog channels, and 360Mpts of storage depth. It also features a 3.58cm thin design, which can save a lot of desktop space, and is equipped with a 14-inch touch screen with a resolution of 1920*1200, which is very clear when observing waveforms. It also comes with the SigtestUI professional testing system; the operation interface is simple and clear, and the operation is smooth and stable.

1、 Sine Wave
We first generated a sine wave with an amplitude of 10V and a frequency of 1.5MHz using a signal generator and input it into the oscilloscope. By adjusting the storage depth and time base, we reduced the sampling rate to the desired value. As shown in the figure below, the time base of the oscilloscope is 2ms, and the storage depth is 36K. The sampling rate = storage depth / (time base * 12), and the sampling rate is exactly 1.5MSa/s.
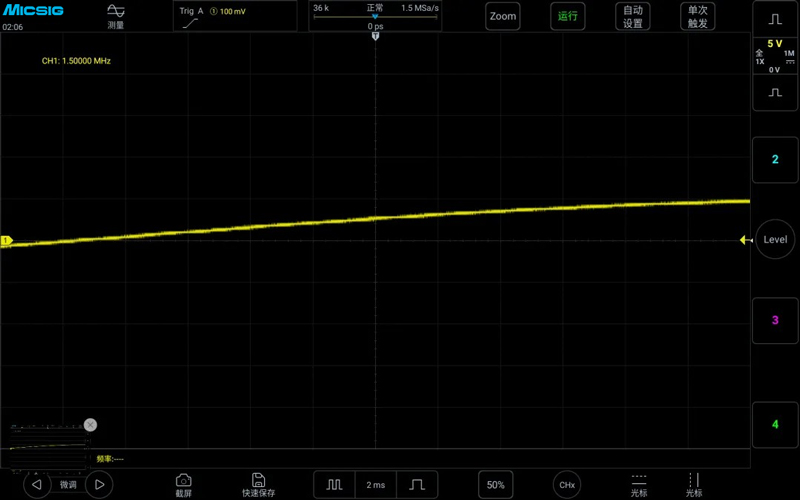
It can be seen that when the sampling rate is equal to the signal frequency, the oscilloscope cannot display a normal sine wave, and the waveform is distorted. However, the hardware frequency counter in the upper left corner can still measure the input signal frequency at 1.5MHz. We continue to increase the time base, keeping the storage depth constant, and at this time, the sampling rate drops to 150KSa/s. It can be seen from the oscilloscope screen that the signal is a sine wave, but the signal frequency has dropped from the real 1.5MHz to 9.204Hz, which is the aforementioned signal aliasing caused by insufficient sampling rate.

Next, we reduce the time base, which increases the sampling rate, and observe the signal changes when the sampling rate is 4 times and 10 times the signal frequency, which is 6MSa/s and 15MSa/s. The signal on the left in the figure below is at a sampling rate of 6MSa/s, and it can be seen that the signal frequency has returned to 1.5MHz, which is the correct frequency value. However, the original sine wave has turned into a triangle wave, and the waveform is distorted. When the sampling rate becomes 15MSa/s, the signal on the right in the figure below, it can be seen that the signal is getting closer to the shape of a sine wave, but it is still not very beautiful.

We continue to reduce the time base, making the sampling rate 20 times the signal frequency, which is 30MSa/s. At this point, a relatively beautiful sine wave can be seen. It can be concluded that to observe a 1MHz sine wave, the sampling rate should be at least 20 times or more to better restore the true appearance of the signal.

2、 Square Wave
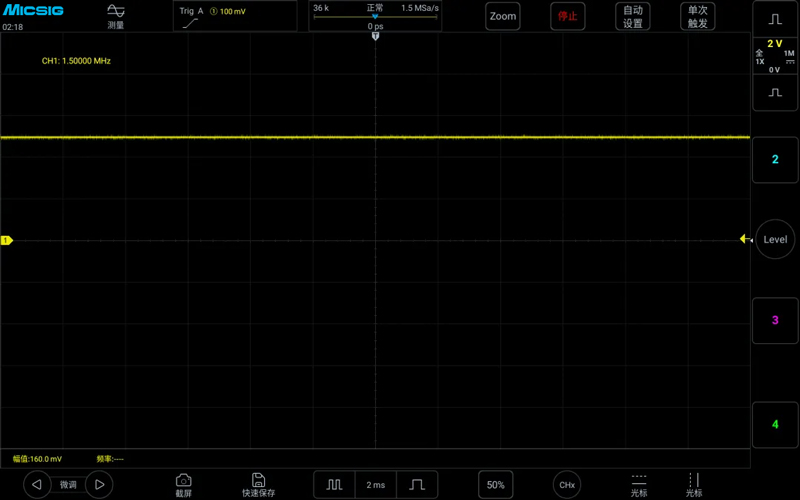
Similarly, we measured a 1.5MHz square wave with the same method. When the sampling rate was 1.5MSa/s, the measured signal turned into a straight line, as shown in the figure below:
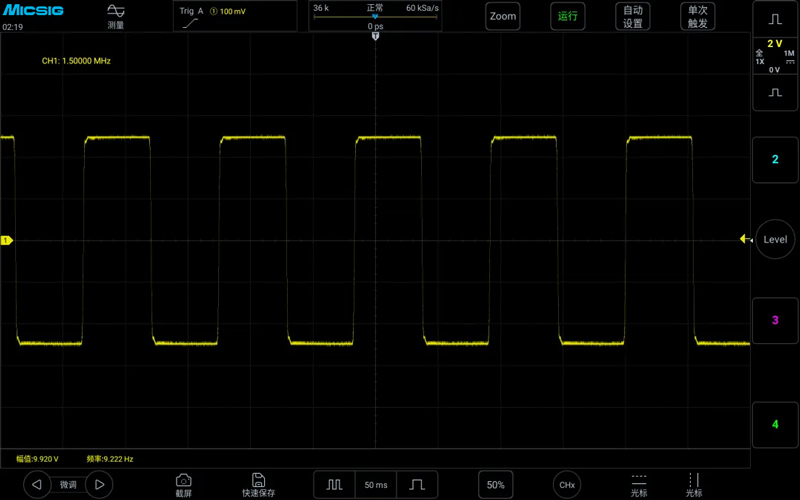
Measuring a 1MHz square wave with a sampling rate of 60KSa/s, the measured signal frequency turned into 9.222Hz, and signal aliasing occurred, as shown in the figure below:
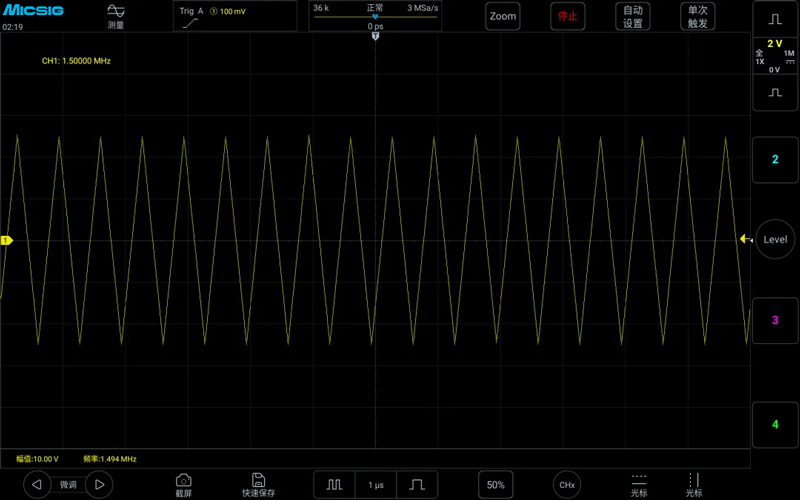
Measuring a 1.5MHz square wave with a sampling rate of 3MSa/s, the measured square wave turned into a sawtooth wave, as shown below:
The following figures show the waveforms measured at sampling rates of 15MSa/s, 60MSa/s, and 150MSa/s for a 1.5MHz square wave:
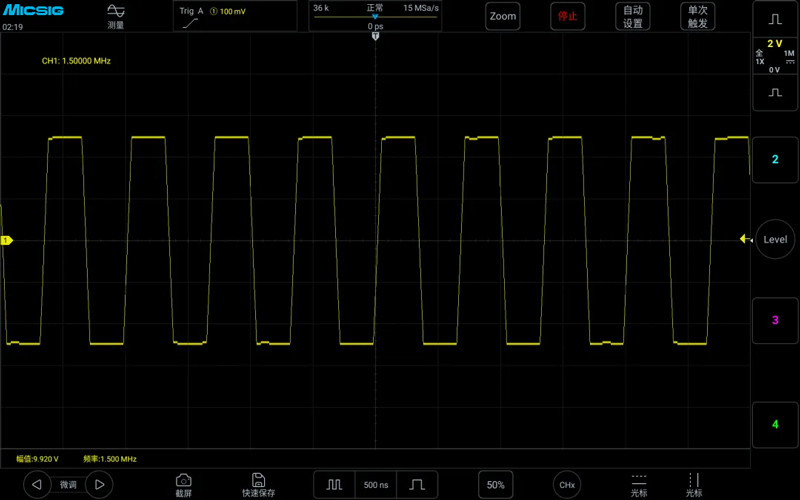
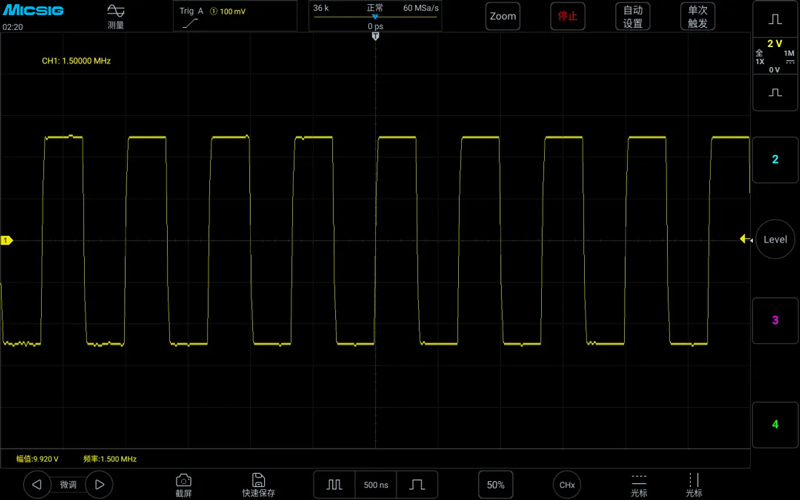
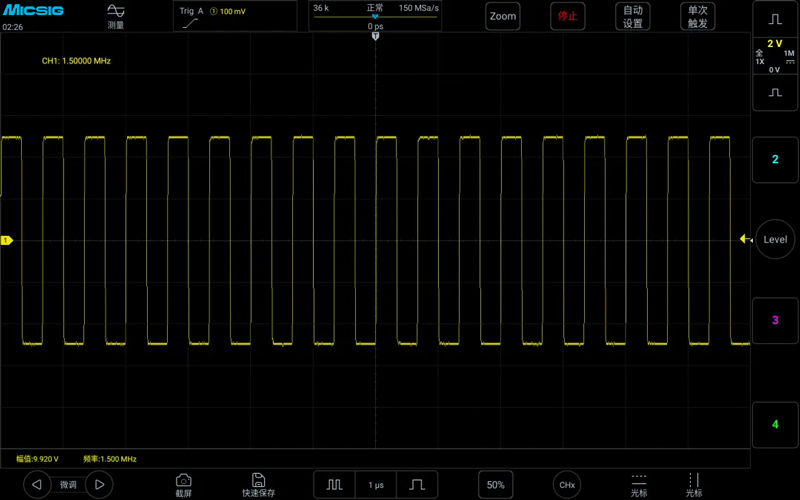
It can be seen that the requirement for the sampling rate when measuring a 1.5MHz square wave is much higher than when measuring a 1.5MHz sine wave. Measuring a 1.5MHz sine wave can approach the true signal at a sampling rate of 20 times, while measuring a 1.5MHz square wave even at 40 times the sampling rate, the rising edge is still quite明显的 not straight. The main reason is that the 1.5MHz square wave is only its fundamental frequency of 1.5MHz, and it also contains higher frequency harmonics. Therefore, for square wave signals, it is far from enough to only meet the fundamental frequency with the sampling rate.
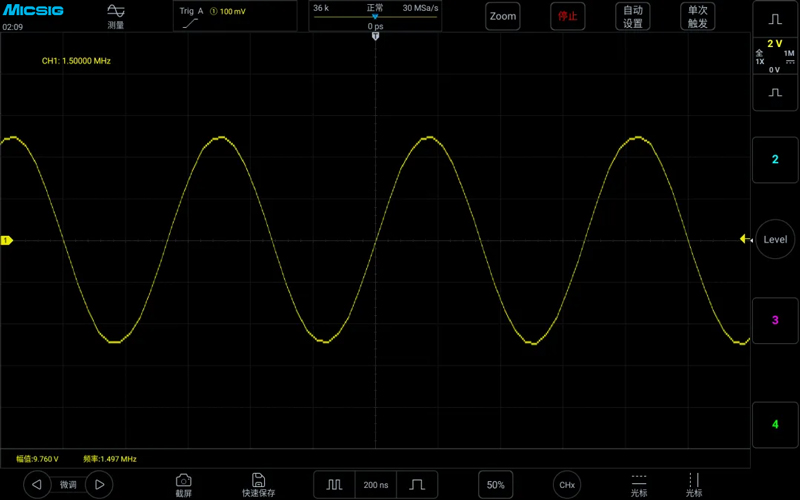
The above figure is: Measuring a 1.5MHz sine wave with a sampling rate of 30MSa/s
3. Triangle Wave
Next, let's test a 150kHz, 10V triangle wave:
Measuring a 150kHz triangle wave with a sampling rate of 150kSa/s, as shown in the figure below:
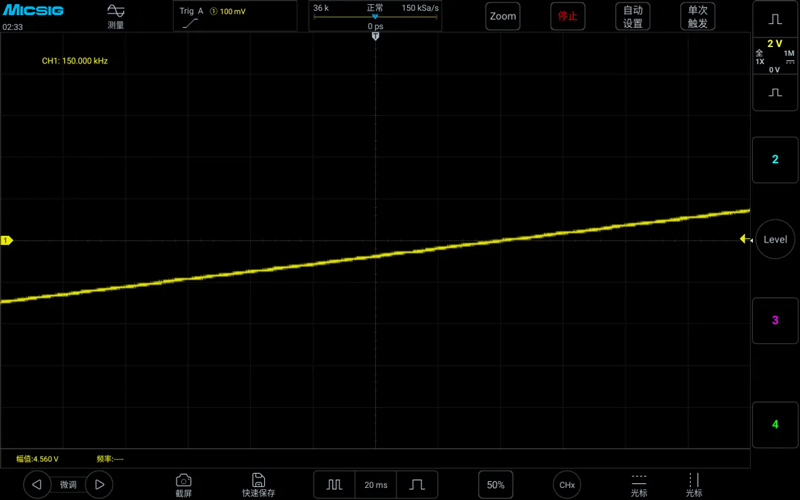
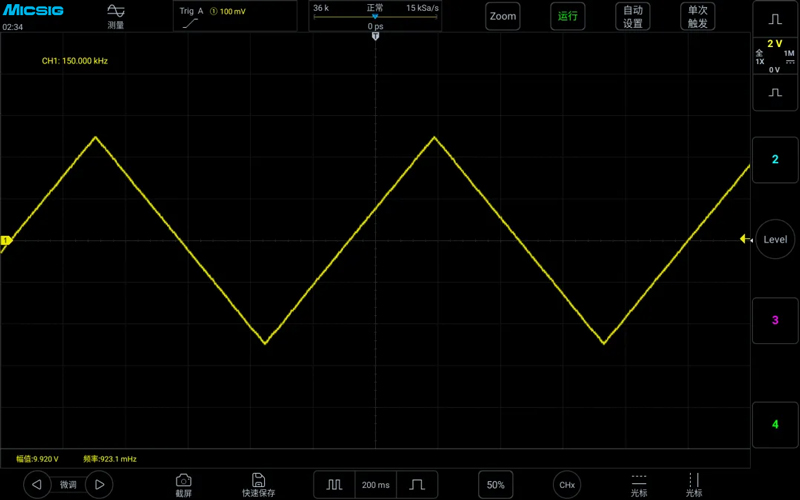
Measuring a 150kHz triangle wave with a sampling rate of 15kSa/s, the frequency changed from 150kHz to 923.1mHz, note that it is m not M, 1000mHz = 1Hz, as shown in the figure below:
Measuring a 150kHz triangle wave with a sampling rate of 1.5MSa/s, the frequency displayed normally, but the waveform was not correct, and there was a voltage difference, as shown in the figure below:

Measuring a 150kHz triangle wave with a sampling rate of 15MSa/s, the frequency displayed normally, and the waveform was also correct, but there was still some voltage difference:

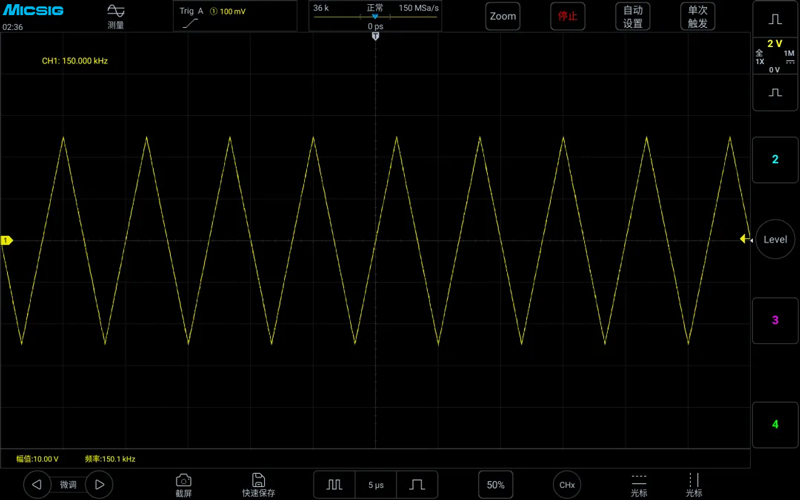
Measuring a 150kHz triangle wave with a sampling rate of 150MSa/s, the frequency displayed normally, the waveform was also correct, and the voltage was normal, the sampling rate was 1000 times the waveform frequency, as shown in the figure below:
4.Sawtooth Wave
Finally, let's take a look at the 150kHz sawtooth wave:
Measuring a 150kHz sawtooth wave with a sampling rate of 150kSa/s, as shown in the figure below:

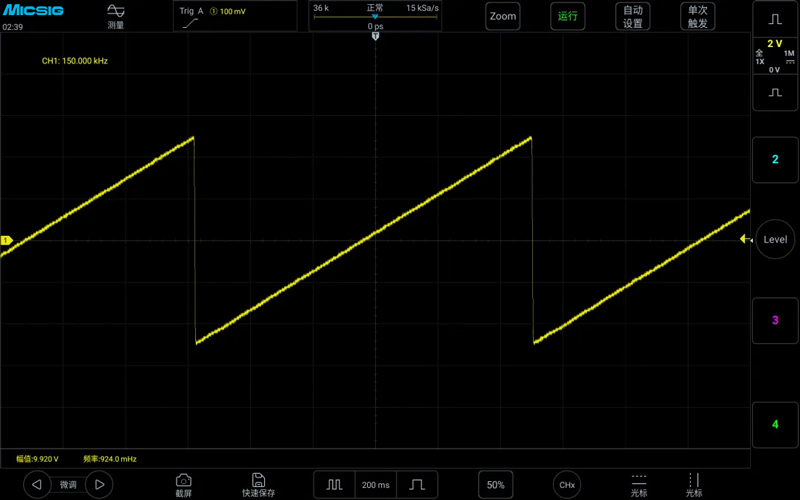
Measuring a 150kHz sawtooth wave with a sampling rate of 15kSa/s, the frequency changed from 150kHz to 924mHz, as shown in the figure below:
Measuring a 150kHz sawtooth wave with a sampling rate of 300kSa/s, the frequency displayed normally, but the waveform was not correct, and there was a voltage difference, as shown in the figure below:
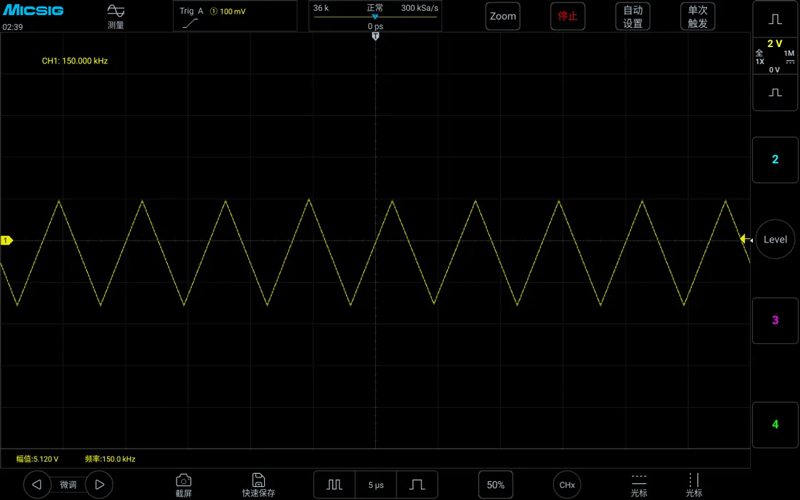
Measuring a 150kHz sawtooth wave with a sampling rate of 3MSa/s, the frequency displayed normally, the waveform was correct, but there was a voltage difference, as shown in the figure below:
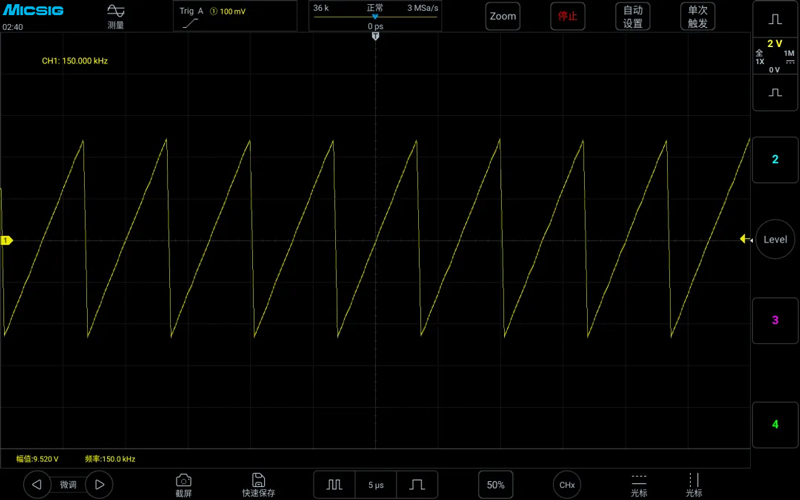
Measuring a 150kHz triangle wave with a sampling rate of 150MSa/s, the frequency displayed normally, the waveform was also correct, and the voltage was normal, as shown in the figure below:

Summary
Through the above series of practical tests, everyone should have a better understanding of the required sampling rate for the measured signal. Sometimes when the measured waveform is far from what you imagined, you can also consider the sampling rate as a reason.
About Micsig
Shenzhen Micsig Technology Co., Ltd. is a leading technology company in the field of signal testing and measurement equipment research and development, manufacturing, and solution provision. It is a national high-tech enterprise and a specialized and innovative enterprise. Micsig is committed to the research and development of cutting-edge technologies in the field of signal testing and measurement, especially in the field of oscilloscopes and oscilloscope probes, where we have always been at the forefront of innovation. We are the pioneers of flat oscilloscopes and leaders in optically isolated probes.
We adhere to our mission and vision, starting from a professional standpoint, continuously breaking through technical boundaries, and helping every electronic field worker and their organizations to be more efficient and excellent.
Every one of our innovations aims to break through the technical boundaries of products and explore new possibilities for industry development trends.
The company's main products include a series of oscilloscopes: high-resolution oscilloscopes, flat oscilloscopes, automotive diagnostic oscilloscopes, split-type oscilloscopes, and oscilloscope probe series: optically isolated probes, high-voltage differential probes, flexible current probes (Rogowski coils), high-frequency AC/DC current probes, and low-frequency AC/DC current probes, etc.

