The Value of Optical-Fiber Isolated Probes in Switch-Mode Power Supply Design: Don't Let a Distorted Waveform Make the Call
Release Time:2026-11-09
Whether to add loop compensation, how to deal with switch-node ringing, and where an EMI failure is coming from — in switching power supply development, a wrong call on any of these three decisions costs far more than a board spin. And all of them rest on one precondition: the waveform you are looking at is real. Getting a trustworthy waveform starts with a choice between two probing approaches: high-voltage differential probes cost less, while optical-fiber isolated probes offer a decisive performance lead and a much wider range of applications — at a correspondingly higher price.
But the trade-off power engineers really face is not the price gap between two probes. It is whether the measurement result can be trusted. Debugging and optimizing against a distorted waveform all too easily sends the entire redesign effort in exactly the wrong direction.
The extra test-equipment spend buys fewer iteration loops, loop compensation designed on the right basis the first time, and a production schedule that holds. Accounted over a full year of R&D, the trial-and-error losses it avoids usually far exceed the price difference between the probes. This article follows that logic: first the core challenges of high-voltage power-supply measurement, then the misjudgment risks created by waveform distortion, and finally how quickly the added investment in an optical-fiber isolated probe pays for itself.
1. The Core Challenges of Switch-Mode Power Supply Measurement
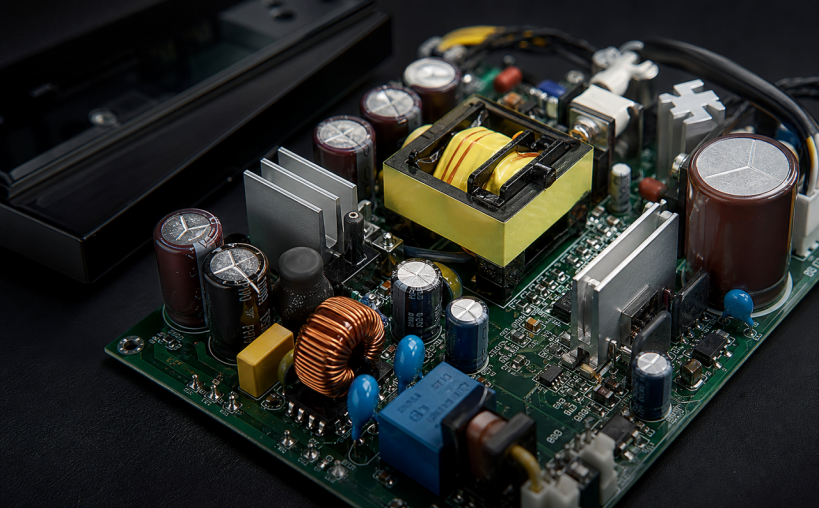
Figure 1A switch-mode power supply and its internal circuitry
Unlike the characterization of discrete components, what is being measured here is system-level behavior: loop stability, ringing risk, and interference tracing. These signals never exist in isolation — they ride on top of high voltages and fast switching edges. The measurement difficulty concentrates in three areas:
First, amplitude span: signals range from tens of millivolts at the synchronous rectifier node to several hundred volts on the PFC bus — a dynamic range approaching four orders of magnitude.
Second, bandwidth span: from 10 Hz for loop stability testing up to several hundred megahertz for ringing and EMI-related phenomena — more than seven orders of magnitude.
Third, floating measurement points: most test points sit at floating potentials. Once connected, the probe itself becomes part of the circuit under test and readily introduces disturbance.
A high-voltage differential probe uses an RC divider followed by a differential amplifier. Its common-mode rejection is set by how precisely the divider network is matched, and it degrades steadily as frequency rises. Taking the published specifications of mainstream high-voltage differential probes as an example, the common-mode rejection ratio (CMRR) is better than 80 dB at DC but falls to only 26–35 dB at 100 MHz. Input capacitance is typically 2–4 pF, which — combined with the lead inductance of input leads more than twenty centimeters long — forms an additional resonant loop once the probe is connected, altering the behavior of the circuit under test.
Changing the measurement architecture removes both limitations at once. The Micsig SigOFIT™ optical-fiber isolated probe works on an entirely new principle: the voltage signal is converted into light at the probe front end and carried over fiber, so there is no electrical connection between the circuit under test and the oscilloscope — no conduction path for common-mode voltage at all. The probe achieves a DC CMRR of 180 dB, still maintains 106 dB at its full 1.2 GHz bandwidth, and its input capacitance can be as low as 1 pF.
The difference between the two, then, is not a small offset in the reading — it can lead to exactly opposite conclusions.
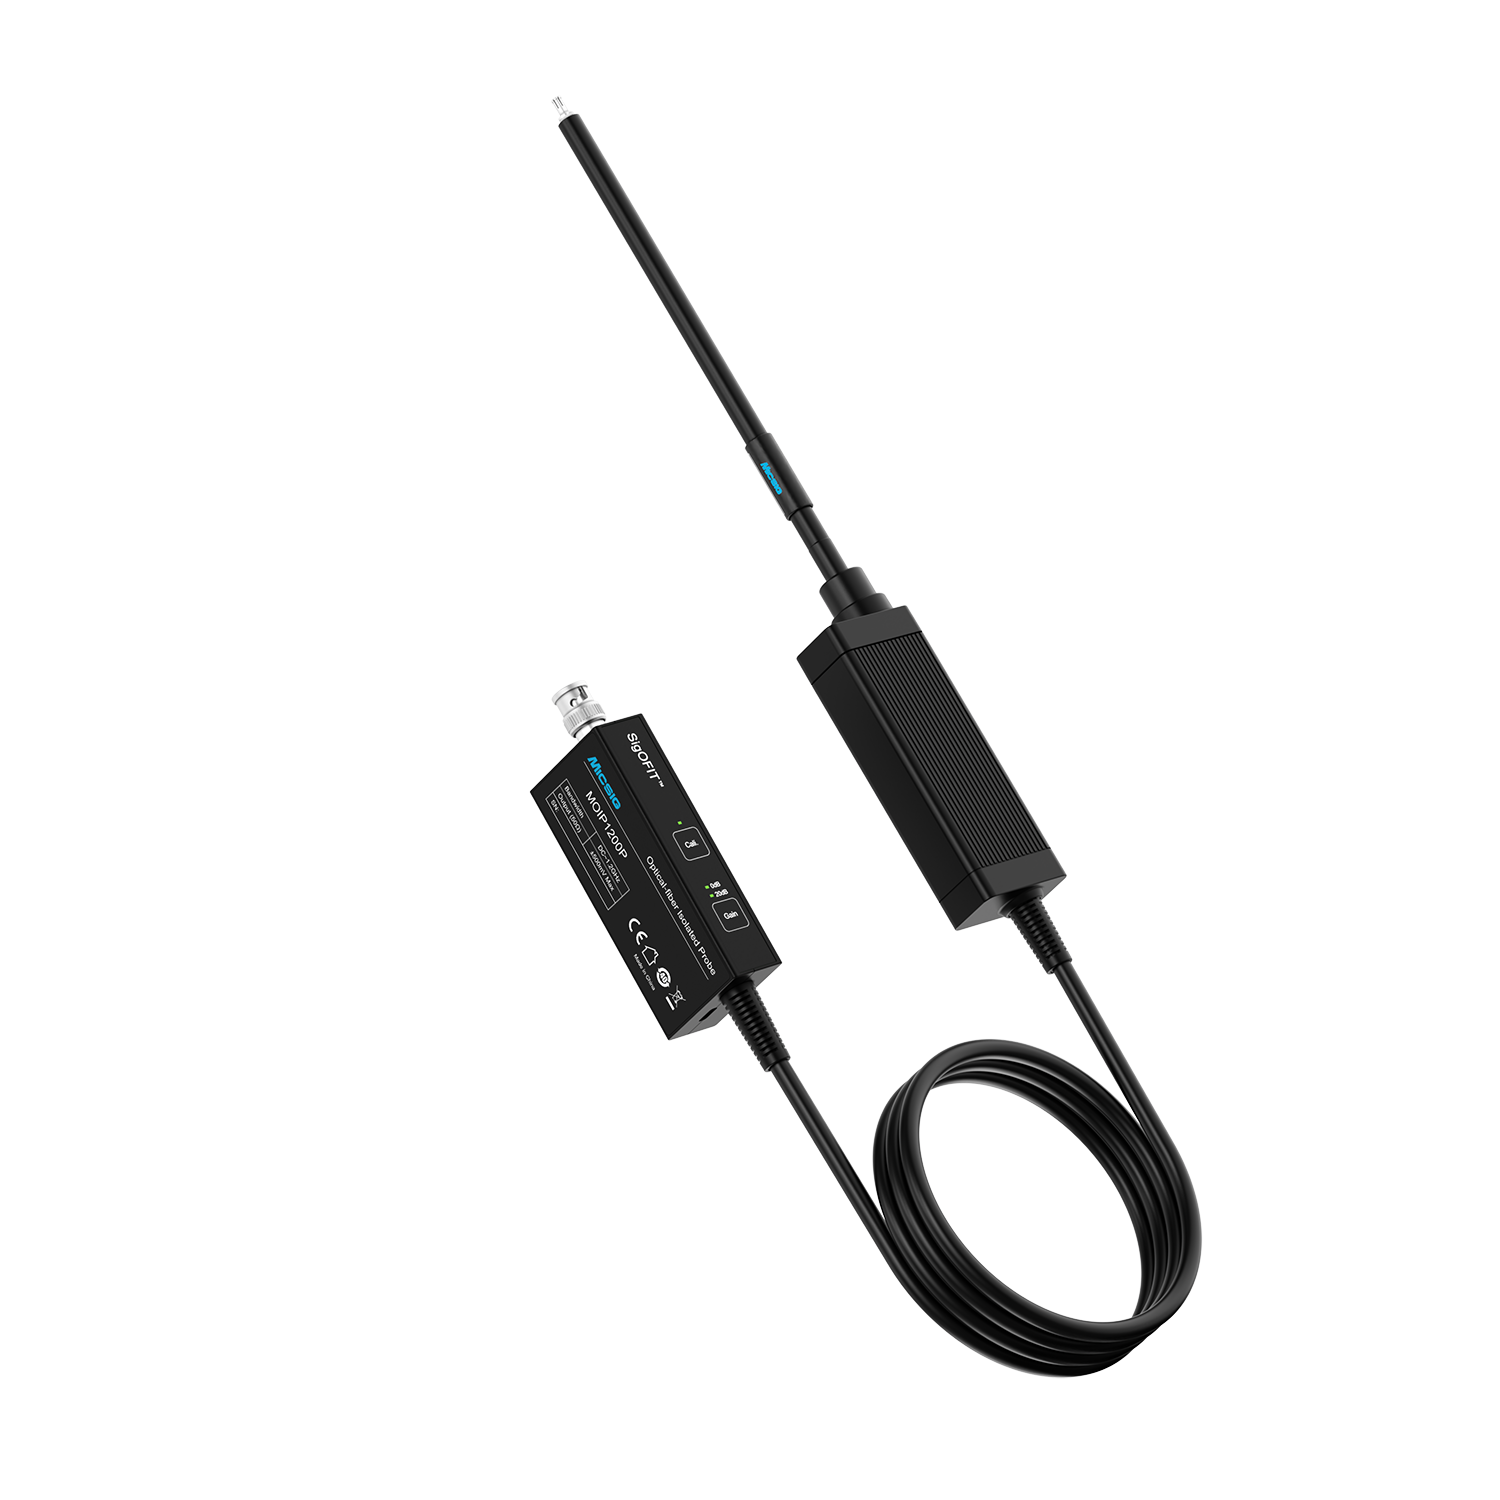
Figure 2SigOFIT™ MOIP series optical-fiber isolated probes
2. Loop, Ringing, and EMI: How the Two Approaches Compare
Amplitude span, bandwidth coverage, and floating measurement points map onto three core engineering judgments in day-to-day debugging. What they all have in common: an ordinary probe disturbs the circuit before it measures it, changing the very signal characteristics you set out to verify.
Decision point | High-voltage differential probe | Micsig SigOFIT™ optical-fiber isolated probe | Benefits of accurate measurement |
Bode plot of the control loop: a tens-of-millivolts perturbation riding on a 48 V common-mode voltage | With 80 dB CMRR at DC, the rejection around 100 kHz can fall below 60 dB; a 5 mV perturbation in the higher frequency band is then swamped, and bandwidth measurements carry large errors | Residual noise below 0.1 μV thanks to 180 dB CMRR — small-signal perturbations are extracted cleanly; CMRR stays above 120 dB up to 100 MHz, so results are stable and trustworthy | Phase-margin assessment closer to real operating conditions, and fewer rounds of compensation-parameter rework caused by misjudgment |
Switch-node ringing: parasitics introduced by the probe itself | 2–4 pF of input capacitance combined with lead inductance can form an additional resonance within the observation bandwidth, distorting both the amplitude and the frequency of the ringing | Input capacitance as low as 1 pF, with a front end that connects right at the test point; bandwidth up to 1.2 GHz preserves the original character of the ringing | Probe parasitics no longer alter the circuit response; less redundant design and lower protection costs driven by ringing misjudgment |
EMI source location: tracing the path of the interference | Edge information suffers loss and attenuation, with pronounced distortion in the low-frequency bands, so the source can only be approached band by band | Higher edge fidelity and a spectrum much closer to the true state of the circuit under test help locate the source and its propagation path quickly | Fewer repeat tests and verification rounds; shorter EMI remediation cycles and less impact on the production schedule |
Notes: Values for the high-voltage differential probe reflect commonly published figures from industry technical literature; values for the optical-fiber isolated probe follow the published specifications of the Micsig MOIP series.
3. The Cost Equation: Payback Across Three Power-Supply Businesses
This section puts both measurement approaches into the same accounting frame — comparing the purchase-cost gap between high-voltage differential probes and optical-fiber isolated probes, and analyzing how long the added investment takes to recover.
For a power-supply development project, the cost of a measurement approach should not be judged on the purchase price alone. Its impact on development cycle, debugging efficiency, and first-pass success must be factored in as well. If an optical-fiber isolated probe reduces loop-compensation misjudgments, lowers the risk of misreading switch-node ringing, and shortens EMI locating and remediation, then the added outlay is recovered through fewer debugging iterations, shorter verification cycles, and lower production-delay costs.
Modeled across three typical business scenarios, the added investment of the optical-fiber isolated probe and the corresponding returns work out as follows:
l Consumer electronics: added investment about ¥20,000; payback in about 2.1 months
l Communications / industrial: added investment about ¥40,000; payback in about 2.3 months
l Server power: added investment about ¥80,000; payback in about 2.6 months
Cost item | Consumer electronics | Communications / industrial | Server power |
Added investment in the probe solution | 2 channels, about ¥20,000 | 4 channels, about ¥40,000 | 8 channels, about ¥80,000 |
A · Certification remediation | 1 event × ¥20,000 = ¥20,000 | 2 events × ¥35,000 = ¥70,000 | 4 events × ¥30,000 = ¥120,000 |
B · Overdesign cost | ¥0.3/unit × 200,000 units = ¥60,000 | 4 rounds × ¥22,000 = ¥88,000 | 2 events × ¥60,000 = ¥120,000 |
C · Debug-cycle cost | 8 projects × 1 engineer × 1.5 weeks × ¥3,000 = ¥36,000 | 6 projects × 2 engineers × 1.5 weeks × ¥3,000 = ¥54,000 | 4 projects × 3 engineers × 3 weeks × ¥3,500 = ¥126,000 |
Total annual savings (A + B + C) | ≈ ¥116,000 | ≈ ¥212,000 | ≈ ¥366,000 |
Payback period on the added investment | ≈ 2.1 months | ≈ 2.3 months | ≈ 2.6 months |
All three tiers are modeled on industry-typical values; we recommend recalculating with your own data. The added investment assumes 2/4/8-channel configurations, which is a conservative assumption. In line A, each server-tier remediation includes retest fees, production delay, and customer audits. Line B uses different bases for the two tiers: the consumer tier is amortized over production volume (¥0.3 per unit, 200,000 units per year), while the communications/industrial and server tiers are counted in development rounds (4 rounds × ¥22,000; 2 events × ¥60,000). Line C is computed as number of projects × engineers involved × weeks saved per project × weekly rate, with the weekly rate set at ¥3,000 (¥3,500 for the server tier) — below the actual labor cost of the engineers involved. Even if the savings in every tier were halved, payback would still come in under six months (4.1 / 4.5 / 5.3 months) — and the gains in end-product competitiveness from more trustworthy data are not even included.
Across consumer electronics, communications/industrial, and server power alike, the added investment in an optical-fiber isolated probe pays back within a short cycle through higher development efficiency and lower remediation costs. The larger the project, the more complex the verification, and the higher the cost of a single remediation, the more pronounced the returns.
An optical-fiber isolated probe, then, is not simply extra procurement cost. By making measurement results trustworthy, it prevents the misjudgments that waveform distortion causes and shortens project verification cycles — lowering the overall cost of development.
4. Closing Thoughts
Return to the three decisions — loop compensation, ringing assessment, and EMI tracing. How reliable each judgment is depends on how true the measured waveform is, yet amplitude span, bandwidth, and floating potentials stack up to distort exactly that. The misjudgments caused by distorted waveforms are the truly expensive part — sacrificing efficiency to fix phantom ringing costs far more than the price gap between probes. The heart of probe selection is not the price tag; it is whether the measurement can be trusted to green-light the design. For silicon-based, low-frequency, steady-state testing, a high-voltage differential probe is sufficient. For GaN/SiC high-frequency work, wideband frequency sweeps, and EMI locating, a trustworthy measurement approach is the precondition for a trustworthy conclusion. The cost model shows that for consumer-electronics, communications/industrial, and server-power businesses alike, the added investment in an optical-fiber isolated probe is recovered within three months through reduced development trial and error.
To evaluate probe selection for your specific topology and operating conditions, or to arrange a hands-on evaluation with a demo unit, contact Micsig at sales@micsig.com or your local authorized distributor.
Data Notes
Product parameters cited in this article are drawn from public technical documentation of the Micsig SigOFIT™ MOIP series; refer to the latest product datasheets on the official website for current specifications. Comparative data are taken from the public datasheets of mainstream high-voltage differential probe manufacturers.
The application scenarios listed summarize common operating conditions in switch-mode power supply development. The benefit calculations are modeled separately for the three business types using industry-typical values; actual returns vary with company size, topology, power level, test scale, team configuration, and operating conditions. Base your own decisions on your own measured data.